Bollinger Band Strategy
Bollinger bands provide a user-friendly alternative to trend channels, revealing the range within which the price predominantly fluctuates. When working with Bollinger bands, you can rely on a signal: if the price significantly breaches the band, it typically tends to revert to the central indicator line.
What to do when you see this signal:
1) Add the Bollinger band indicator to the price chart.
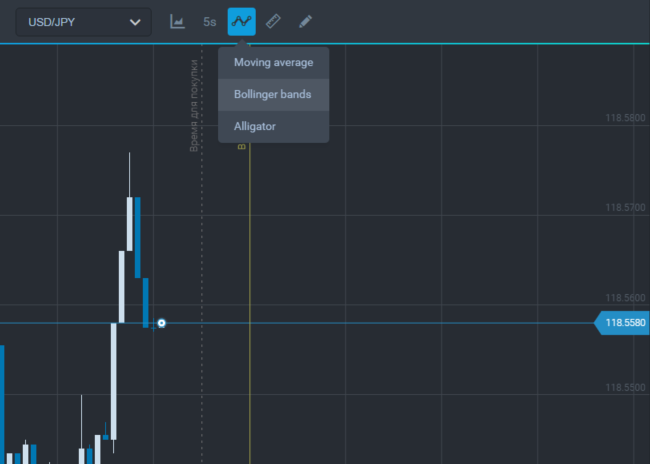
Add an indicator
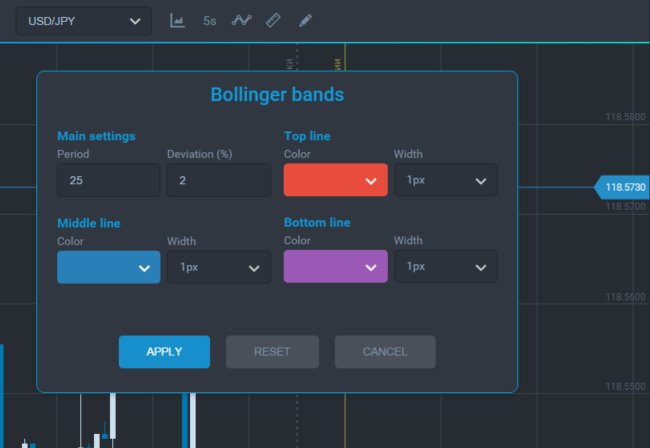
Indicator settings
2) Wait when the price moves outside the indicator.
3) After the price has returned inside and a confirming candlestick has been closed we can open a deal directed towards the central indicator line.
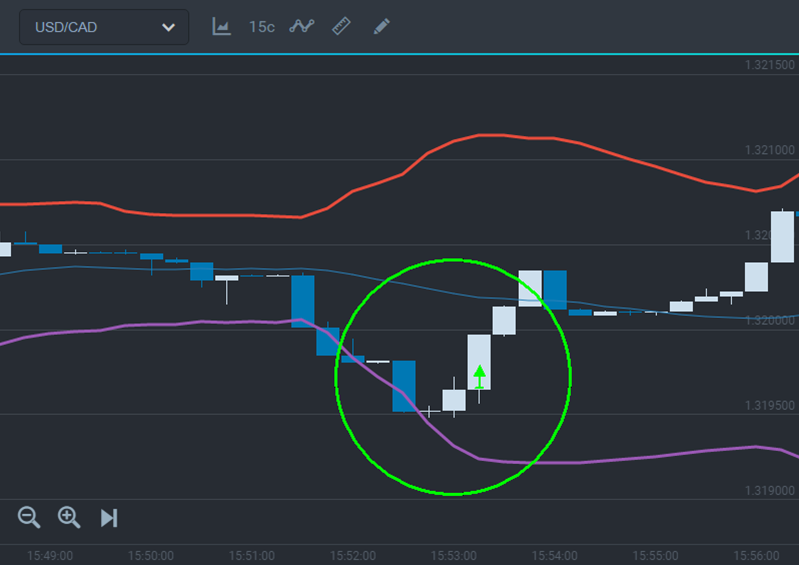
Buying a call after the lower band breakout
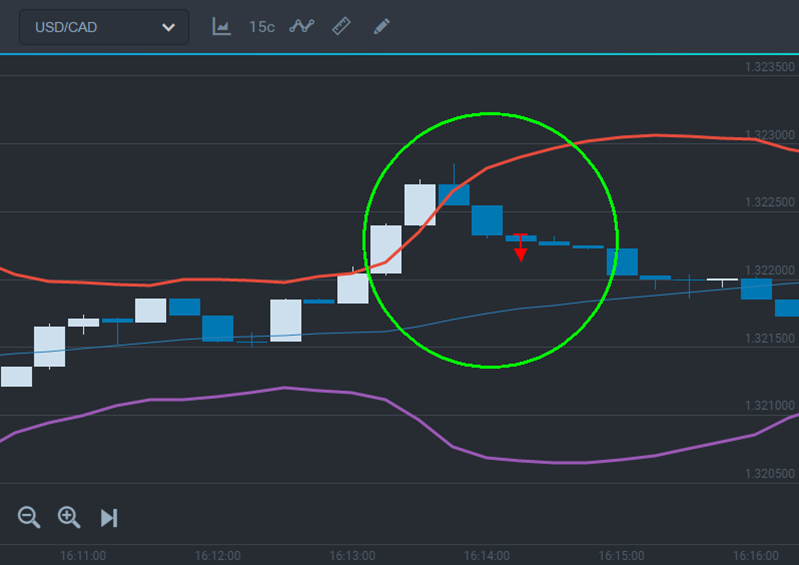
Buying a put after the upper band breakout
The upper and lower Bollinger bands can be used as the levels of support and resistance.
What to do:
1) The price is closed at the upper/lower indicator line.
2) A new candlestick moves in reverse direction.
3) Wait for a confirmation and trade directed towards a central indicator line.
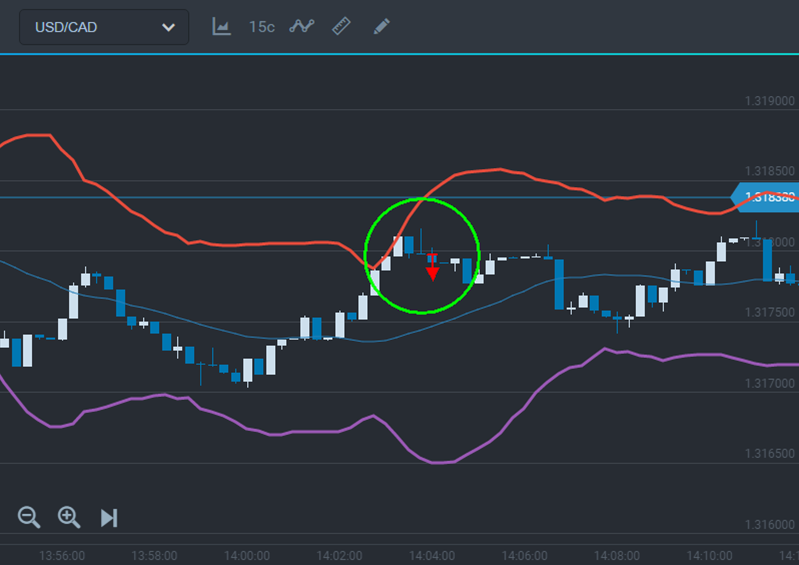
Buying a put after bounce off the upper band — resistance line