- 学习资料
- Trading Strategies
- Parabolic SAR: Tracking Market Trend Momentum
Parabolic SAR: Tracking Market Trend Momentum
Understanding when a trend is continuing or about to reverse can make a huge difference in your trading. The Parabolic SAR (Stop and Reverse) is a straightforward tool that gives visual cues about trend direction and potential exit or entry points. Unlike other indicators, it “sticks” to the price like a shadow, showing you the market’s momentum in real time.
- What is the Parabolic SAR?
- Why traders trust it in trending markets
- How to trade with Parabolic SAR
- Where the SAR falls short
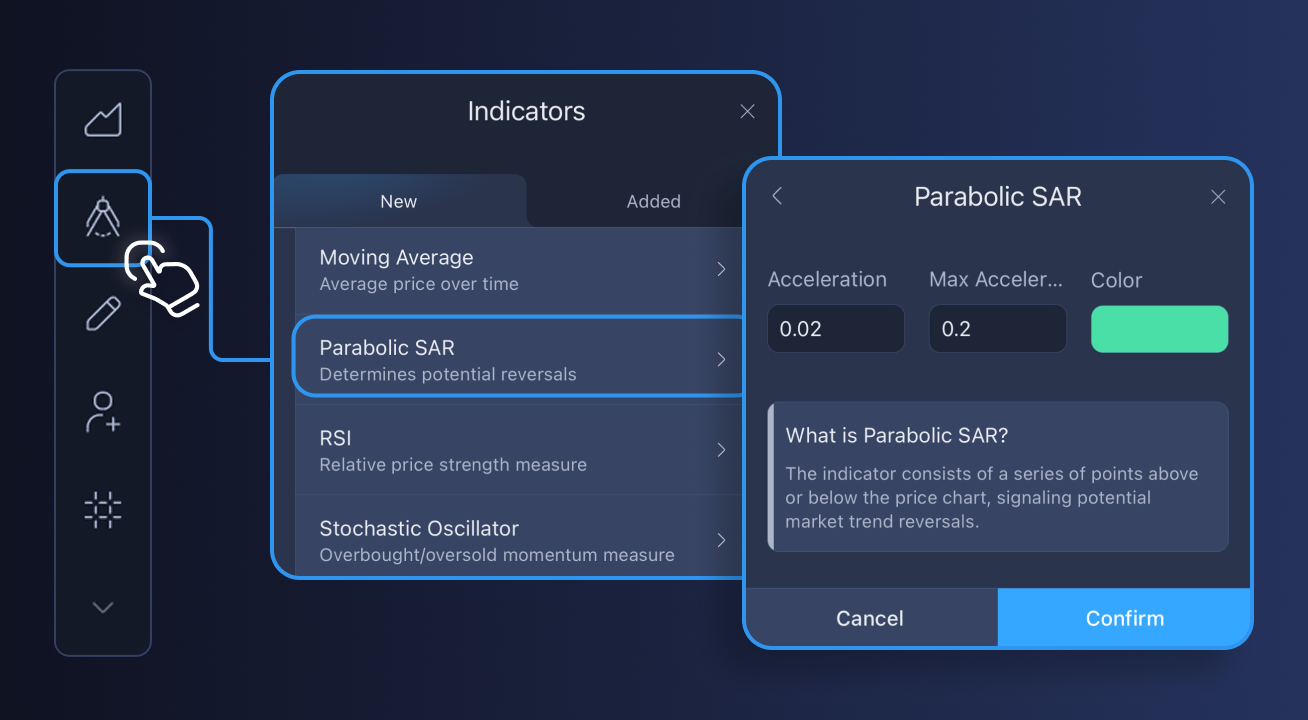
What is the Parabolic SAR?
Developed by J. Welles Wilder, the Parabolic SAR is designed to track price momentum and highlight possible turning points. On your chart, it appears as a series of dots that follow the price action — like footprints showing the market’s path.
- Dots below price: Uptrend in progress — bullish momentum.
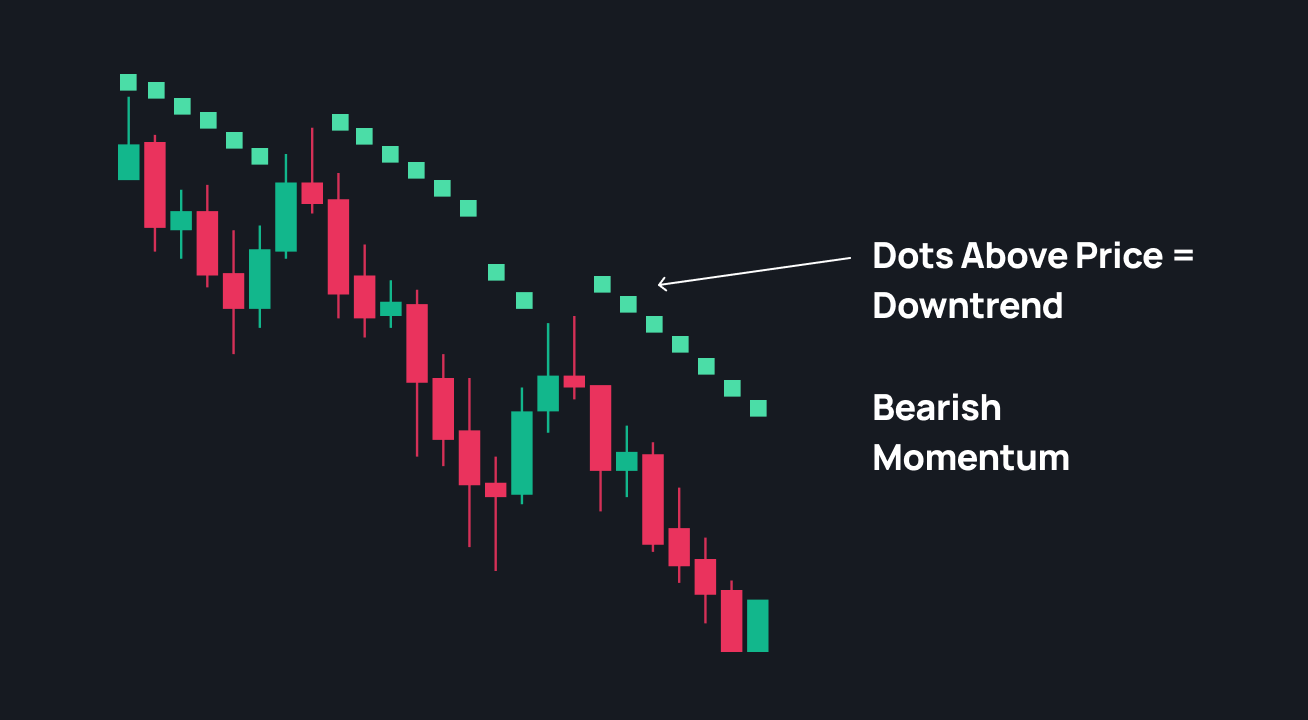
- Dots above price: Downtrend in progress — bearish momentum.
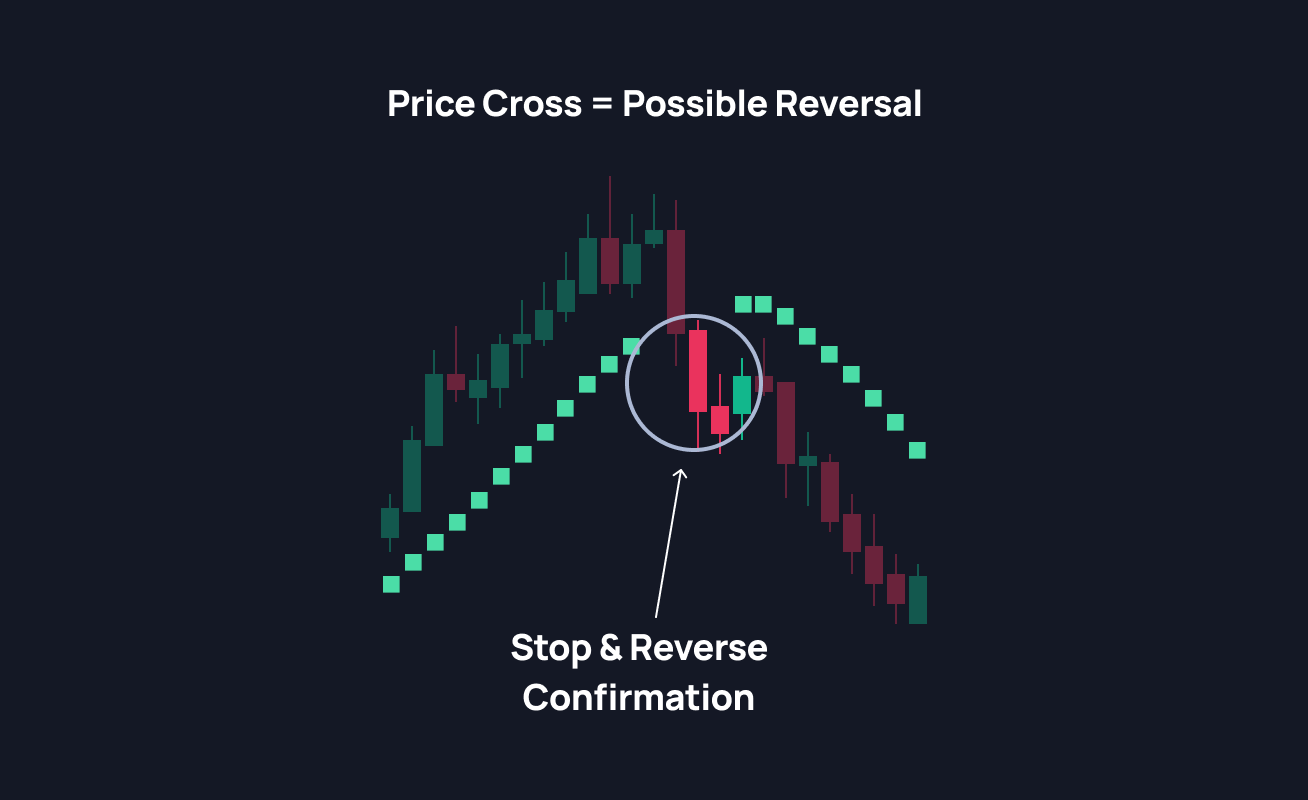
- Price crossing the dots: A possible reversal or pause in the trend.
It’s simple, visual, and effective — especially when used as part of a trend-following approach.
Why traders trust it in trending markets
The Parabolic SAR performs best when the market has a clear direction:
- In an uptrend, the price tends to stay above the dots, giving traders confidence to hold long positions.
- In a downtrend, the price remains below the dots, helping identify short opportunities.
Because SAR adjusts dynamically with price movement, it acts like a built-in trailing stop — locking in returns as the trend extends.
Tip: Avoid using SAR alone in sideways markets — false data is more common. Use it alongside trend filters or momentum indicators for clarity.
How to trade with Parabolic SAR
Traders commonly apply SAR in three main ways:
1. Riding the trend
- Call when dots shift below price.
- Put when dots shift above price.
This simple visual cue helps you align trades with momentum instead of fighting it.
2. Spotting reversals
When the price crosses the SAR dots, it indicates a potential trend change. Traders often use this as a trigger to close existing positions and reverse their direction.
3. Setting trailing stops
SAR dots naturally adjust with price — perfect for automating stop-loss placement. This helps protect gains while staying in lucrative trades longer.
Where the SAR falls short
Like any indicator, the Parabolic SAR has limitations:
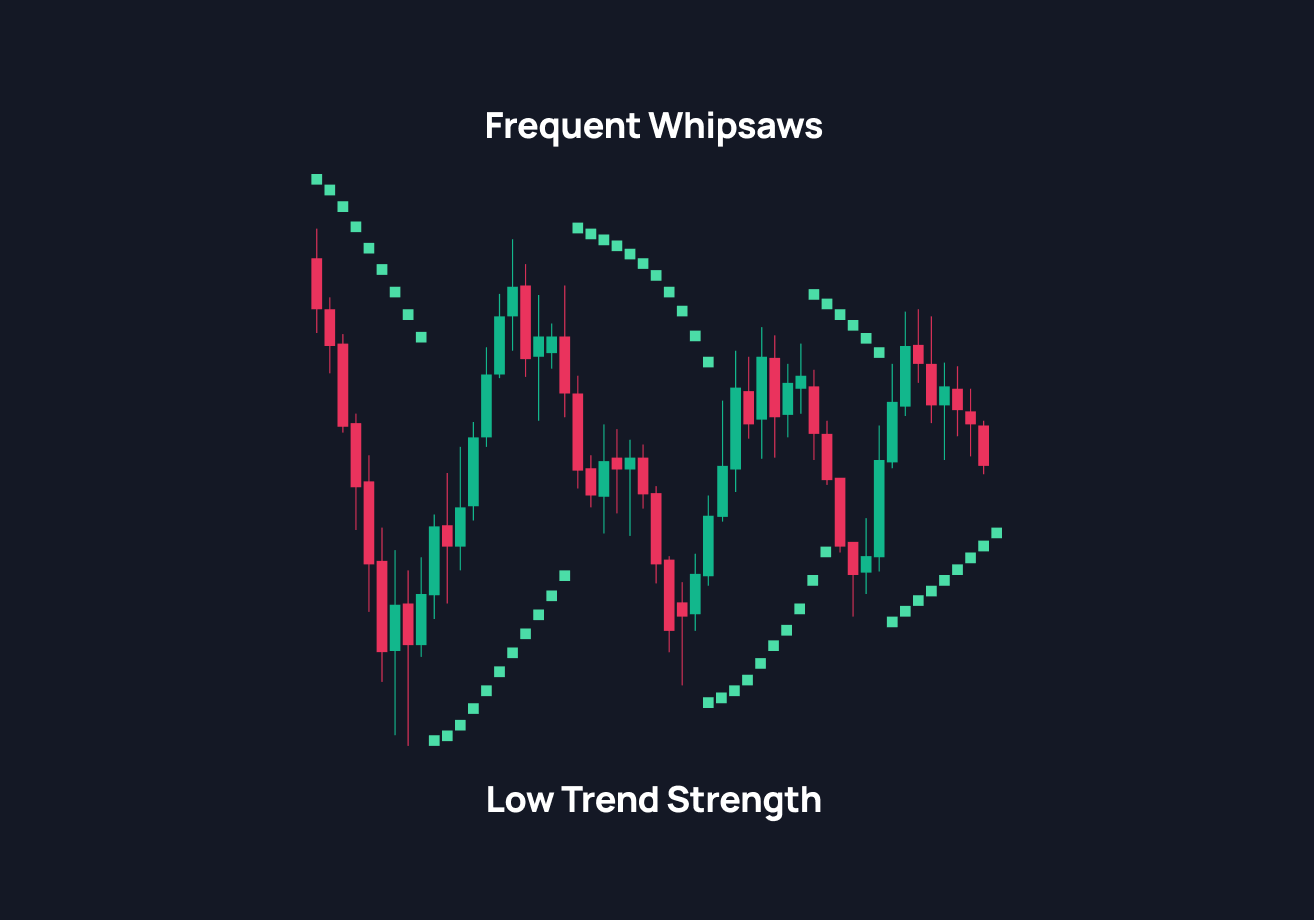
- Lagging in choppy markets: Frequent reversals can lead to whipsaws.
- Not a standalone tool: Works best when confirmed by trend or momentum indicators.
- Less reliable in consolidation: False data can appear when price ranges tightly.
That’s why most traders use SAR as a supporting indicator, not their only guide.
To strengthen your analysis, pair the Parabolic SAR with complementary indicators:
- Moving Averages: Confirm overall trend direction
- RSI (Relative Strength Index): Spot overbought or oversold conditions
- MACD: Validate momentum shifts and potential reversals
The Parabolic SAR is a straightforward yet powerful tool for managing trades within trending markets. It tells you when to stay in, when to exit, and when momentum might be shifting.
Start by testing SAR on your charts, experiment with different timeframes, and combine it with your preferred trend or momentum indicators. Every reversal you spot early — and every trend you ride with confidence — builds the discipline that turns good trades into great ones.